
COPC Inc.’s Bridget Hewitt-Cartwright and Alex Boland provide an overview of the findings from the 2021 Australian Banking Customer Survey.
Watch Webinar

Transcript
Alex Boland:
Morning folks, my name is Alex. We will give everybody one minute or so to join us. So in a minute or so, we will actually kick off. Thank you for being timely. I’ll come back to you in a minute. Good morning, everybody. Thank you for joining us for this webinar today. For those of you who haven’t met me before, my name is Alex. I’m the director of operations for Australia, New Zealand for COPC, and I will be chairing the webinar today. So I will come back at the Q and A at the end. So at any stage, as Bridget is sharing the findings, there is a Q and A button you can submit questions. We’ll try to get through as many of them as we can. And I also have an opportunity to introduce Bridget here. So, Bridget is part of our team here in Australia and New Zealand. She has experience in outsourcing in in-house centers and in vendor management, running really large operations offshore. She has gone through all the data, delved out some of the insights, and she’ll be sharing those with you now. Bridget, take it away.
Bridget Hewitt-Cartwright:
Thanks for that, Alex and welcome everyone and thanks for joining us for the latest insights from our annual Australian banking customer survey. It’s nice to see a few new faces as well as a number of you who were in our 2020 webinar. So, welcome and welcome back. So in terms of housekeeping, as Alex mentioned, we’ll have time for a Q and A at the end of the session. So keep your questions coming in the Q and A feature. You will receive a copy of this report and the recording of the webinar in the coming days. But of course, if you have additional questions or thoughts that come up after the session, don’t hesitate to reach out to myself or Alex. So as you may know, COPC has been conducting this research on Australian banking customers for the last six years. And the data we’re taking you through was captured in the second half of 2021. So I have a range of respondents in terms of age and tenure with their banks. And about three quarters of respondents cited the big four as one of their main banks. Now, although we surveyed customers regardless of whether they’d had a recent interaction with their main bank, most of the findings that we’ll focus on in this session will focus on the contact experience, the interaction experience in banking.
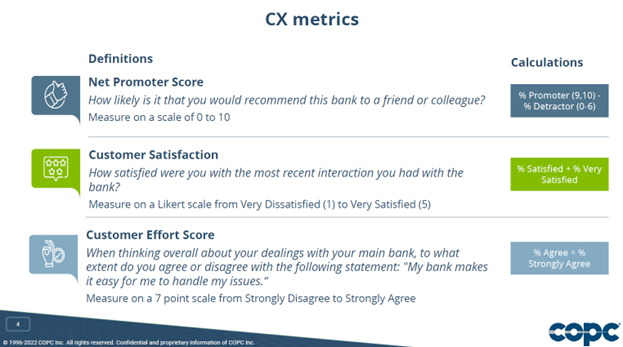
So let’s take a look at our first piece of data. Nearly 60% of customers that we surveyed had had some interaction with their main financial institution in the last three months. And as you’ll see, as we go through some of the data later, that’s a significant proportion of customers where we have an opportunity to either make or break relationships. Now, before we look at some of the results, I wanted to take you through some of the top line CX metrics that we have asked in this survey, in terms of the specific questions and the calculations of the measurements we’ll be showing you. So the first metric we asked, the first measure, is an NPS question. So straightforward, would you recommend the bank to a friend or colleague? Of course measured on a scale of zero to 10 and we subtract the detractors from the promoter score. Now we’ve also asked a CSAT question specific to the interaction. So we’ve measured this on a five point scale and the CSAT number you’ll see is the percentage of satisfied and very satisfied, which we call the top two box performance. Finally, we’ve asked a variation on a customer effort score question. So when thinking about your dealings with your main bank, to what extent do you agree that your main bank makes it easy to handle issues? And we’ll measure that on a seven point scale, the customer effort score you see will be based on the percent who agree or strongly agree with that statement. So let’s take a look at some of the performance metrics for the industry. Now, these next few metrics are based solely on customers who actually had a recent interaction with their bank. And keep in mind that number was about 58% of the customers that we surveyed. So nearly 85% of customers said they were either satisfied or very satisfied with their interaction. So as you may know, COPC performs global benchmarking of customer contact organizations and have done for the last 25 or so years. The typical high performance benchmark for CSAT is 85%. So if we see 84% for the industry at large, it’s a fairly strong performance, and of course that’s going to vary cross organizations. Next, our customer effort score.
Bridget Hewitt-Cartwright:
So the top two box performance on customer effort for customers who had an interaction with the bank was 72%. Again, a fairly strong performance compared to industry benchmarks. Now, finally, the NPS score for customers who had an interaction with their bank was positive 30. So again, this NPS that I’m showing you now is just for customers who had actually had an interaction with their bank and we’ll look shortly at all customers. So overall, in terms of these metrics, it’s fairly strong performance for the industry. And I think that speaks to the continuous effort that we’re seeing to emphasize customer experience. So the challenge is really now to continue to push the dial on optimizing the experience, to simplify the experience for customers. So, as I mentioned, we’ve been conducting similar research for the past six years, and you can see now on the screen, the NPS scores are from our respondents over the last six years. So you can see the most recent data is positive 19. Again, that number is slightly different because this data is showing all customers, regardless of whether they contacted or didn’t contact. So it’s more of the brand level NPS. But what you can see is that apart from the 2018 year of the Royal Commission, the NPS for the industry at large has remained steadily positive. Now to start considering some of the insights from our most recent survey, let’s talk a little bit about channel preference. So we are customers thinking about their most recent interaction, which channels did they use to try to resolve their issue? Now, keep in mind, as you look at these numbers, they won’t add up to 100%. Customers were able to select multiple channels. And you can see that by far customers still are utilizing the phone channel.
Bridget Hewitt-Cartwright:
So 56% of customers tried to use phone to resolve their issue, followed by in person, so face to face or retail interactions. But what really must be noted is that 47%, so nearly one in two customers, needed to use multiple channels to resolve their inquiry.
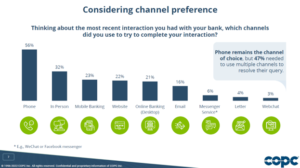
So for this cohort of respondents only half were able to resolve their issue through a single channel. And that really speaks to the fact that increasingly customers are needing to use multiple contacts, multiple touch points on their journey to resolve an issue. We’ll touch on that a little bit more later. And on that note of channel preference, we’re often asked by our clients, what are we seeing in terms of customer sentiment and adoption towards digital assisted channels? And we did ask customers, would they be happy dealing with an automated banker for either through artificial intelligence or even their adoption of mobile apps? Now, as you can see, four outta five customers are open to automation of at least the simple issues, and one in five would be willing to use it for everything. Those numbers are slightly higher for big four customers and multi-bank customers. So what this tells us is that customers on the whole are fairly open to further automation, to AI and to digital assisted experiences, and to getting their issues resolved online. But what’s really important is that we need to get it right. So we ask customers whether they had tried to resolve the inquiry themselves online before interacting meaningfully with the bank. And the data tells us that nearly 70% of customers had actually tried to find a solution online before contacting their bank. So that’s over two thirds of customers who were willing to jump online, try to get their issue resolved maybe by a self-service or even searching your knowledge base or searching outside of your website, performing a search engine search to try and find an answer. So there is a great willingness of customers to try to self serve, but what we can see is that still we’re not converting, we’re converting too many of those customers to have to then use traditional channels to get support. So if we can convert even a number of these customers to just using self-service, it obviously represents a huge cost saving terms of contact prevention to our traditional channels. But what we also found is that 27% of customers found their interaction with the website to be either complicated or very complicated. And that’s slightly higher than what we see for all channels combined. So we are still seeing that customers are struggling to get their issues resolved online and struggling to navigate websites to find the answer themselves, or to use your self-service technology. So what we’ve learned so far is that nearly 50% of customers need multiple channels to resolve their issues. Nearly 70% of customers are willing to jump online themselves and try to find their own answers before actually contacting their bank. And nearly 30% of customers found their website interaction to be too complicated.
Bridget Hewitt-Cartwright:
So what that really speaks to is that the customer’s experience with their service, with trying to get an issue resolved really takes place in the silo of a single interaction. The customer’s experience with your brand is generally the sum of multiple interactions, even just to get a single issue resolved. So what we recommend is instead of focusing on optimizing the experience on individual channels, say improving the experience or the CSAT on your phone channel, is start to focus more on your service journeys. Now we define service journey as the end to end path taken by a customer using any combination of your support channels in order to resolve the customer request or the need. So if you think about traditionally in the customer contact space, we’ve really thought about siloed channels, voice channel, retail channel, email channel, and really thinking about measuring and improving these channels in a very vertical kind of mindset.
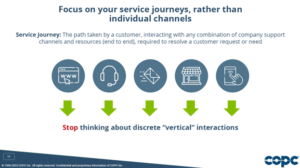
So what we encourage you is to stop really thinking about these discreet vertical interactions, because these aren’t how customers actually experience your service Customers experience your services as horizontal service journeys. So if you think about it to solve a single issue, one customer may just need to make a single phone call and have their issue resolved straight away. For another customer it may involve first sending an email, not getting a reply and then making a phone call and needing a second follow up in order to get their issue resolved. So customers experience your brand as the sum of multiple touch points. So really when you’re thinking about the experience for your customers and optimizing, reducing the complexity, focus less on thinking about individual channels; the voice experience, the web experience, the email experience, and start to think about more what are the service journeys that your customers are trying to achieve successfully? So you might think about the journey to become a new customer, the journey to update contact details, or the journey to apply for a new loan or a new product. Thinking about your customer’s experiences and their journeys in this way will allow you to start to work towards simplification of that experience. In customers who find their interaction to be simple cite higher satisfaction. So the data we’re looking at here is the three CX metrics I mentioned up front. So the navy blue color is the CSAT. The green is the customer effort score. The lighter blue is the NPS score.
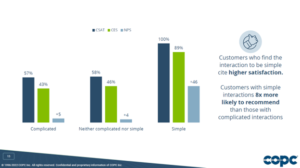
And we’re looking at the results by whether the customer felt their interaction was complicated, neither complicated nor simple, or simple. And without me even sort of reading these numbers to you on the screen, you can see that the satisfaction, the NPS and the CES for those customers who found their interaction to be simple is staggeringly higher than those who didn’t. In fact, the customers who found their interaction to be simple are eight times more likely to recommend than those who don’t. Okay, I’m going to launch a poll now, and I’m interested in your thoughts, your own experience, your own assumptions. Based on the attributes I’m going to show you, which do you think most strongly drive loyalty in customer contact? So I’ll just leave that up for a moment longer, give everyone a chance to respond.
Bridget Hewitt-Cartwright:
Okay, and we’ll end that now. Okay, we’ve got a good mix of responses there. Most seem to be leaning towards either speed of answer or issue resolution. Now, depending on your organization, and you may have performed your own analysis in the past. The attributes that actually statistically drive customer loyalty and satisfaction can vary, but in our research, including in this set data, but in a lot of the other research we’ve conducted globally and across organizations, the consistent theme we see is that issue resolution is most critical in underlying customer satisfaction. So generally when we perform correlation analysis between issue resolution and CSAT we tend to see the higher the issue resolution, the higher the CSAT, the lower the issue resolution, the lower the CSAT. But another way I want to show you this data is really thinking about different NPS for customers based on their experience getting their issue resolved. I wanna start with showing you kind of a baseline for NPS that we can use to understand this. So all of these bars on the screen are based on the customer’s NPS for our survey. What I want you to look at first is the left hand side. These are the customers who we surveyed who didn’t have a recent interaction with their bank, who didn’t contact the bank in recent times. Their net promoter score was positive eight, so on the slightly more positive side of essentially neutral. They’re probably not thinking about their bank day to day. They’re kind of just idling along, not really feeling one way or the other. So these are the customers who didn’t contact us at all. So if they didn’t contact us, fairly neutral. Now this middle cohort of customers is super interesting. These are the customers who did contact their bank and had their issue resolved at some point. So you can see the overall bucket is positive 32. So if a customer contacted their bank and had their issue resolved, whether it was immediately or eventually, the NPS is four times higher than those who didn’t contact at all. You can see that’s even higher if they had their issue resolved in a single contact. That’s still almost three times as higher if they had their issues resolved in two contacts. It’s not until their issue is resolved in three or more contacts that we see that NPS drop back down to that somewhat positive, but fairly neutral NPS. So again, we haven’t created necessarily detractors by taking so long to get their issue resolved, but we’ve missed an opportunity to see what we see for those who have their issues resolved in one or two contacts, which is a huge opportunity to build relationships. If we can get the majority of contacts resolved in one step and maybe the more complex issues resolved in just two steps, that’s a huge opportunity to build loyalty. And then on the other side, if we don’t resolve issues, the behavior we see is that our NPS becomes really negative. So these are the customers who did make contact with their bank and didn’t have their issue resolved at all. Or within that last three months, they’re still waiting on a resolution. So customers really are trying to contact you because they have an end goal in mind. We spend a lot of time on things like soft skills, on things like speed of answer, which are really important, but fundamentally the consistent driver we see of loyalty and of satisfaction relates to issue resolution.
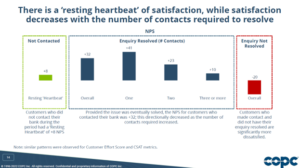
Issue resolution overall, but also the number of contacts to get your issue resolved. And you can see that reflected here as well. We ask customers how likely is it that you’ll change your main bank in the next 12 months? And looking at this data, just for those respondents who had contacted and had an issue resolved, those who had their issue resolved in one contact, 6% were considering changing their main bank in the next 12 months. Now that’s still a significant proportion, but is a lot lower than what we see, even for two contacts. So if it takes two contacts to resolve the issue, double the number are thinking of changing their bank in the next 12 months. That is significantly higher if it takes us three or more contacts to resolve the issue. Perhaps at that point where it’s taking three or more contacts to resolve the issue, the issue has become far too complex for the customer to deal with. They’ve become frustrated and they’ve lost faith in our ability to deal with the issue. So we really should be focusing on resolving ideally in one or two contacts and designing our services, designing our processes, and really putting our energy into focusing on how we can achieve those. So what we implore banking institutions to really focus on is primarily on issue resolution and really making an effort to reduce complexity so we can achieve that first contact resolution or at worst, second contact resolution.
Bridget Hewitt-Cartwright:
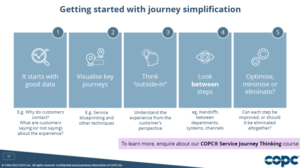
How do we actually go about doing that? Well, it’s important to keep in mind that the vast majority of your opportunities for improvement are going to come from process level, from organization wide improvements, not necessarily from individual agent improvement. So we teach a one day course on what we call service journey thinking, which really helps you start to implement some of the practices you need to simplify your journeys, but I wanted to give you a taster for that today so that you have some insights to take away to even start right now, with starting to plan on how you’re going to simplify your journeys. So the first tip is really starting with making sure you have good data. You need to understand why a customer’s contacting you, of course, but also really drilling down on which issues are getting resolved and which aren’t, and ideally, why aren’t they getting resolved. Once you have that good data as a starting point, we really recommend visualizing your key journeys. Now, in our course, we teach the concepts of service blueprinting, but there’s so many other techniques that you can use to visualize your service journey. Even working with the team with post-it notes, with pen and paper, and really starting to collaborate with the cross-functional team, just seeing the journey visualized can start to help identify what are those pain points, what are those friction points that our customers might be experiencing. Now, because of the complexity of banking, you could have dozens, if not hundreds of different what we would class as service journeys, so that some of that I mentioned upfront were applying for a new loan or product or updating contact details, but even something as simple as resetting a password could be considered a service journey. So I’m not saying you should go and visualize every single service journey. What you should do is prioritize what are those service journeys that are the highest frequency and the highest impact. And using the data, using the customer insights from the first step, understanding which of the ones we really need to focus on. As you’re doing this process and you’re working with your team and you’re starting to look at these service journeys and understand, okay, what are the areas for optimization? It’s really important you keep in mind this outside-in thinking, really putting yourself in the customer’s shoes and thinking about this process design, this service design, from the customer’s perspective. Not from the perspective of what’s going to work with our existing systems and tools and technology, but thinking what are customers trying to achieve and how can we get to that point where we’re making it as easy as possible for customers to achieve it? As you’re reviewing your service journeys, and you’re looking at the individual steps, don’t just look at the steps themselves, look between steps. Look how many times is a customer being passed off between different departments or between a system and a human agent, or even in the backend processes, how many different systems are needing to touch a single customer interaction? Really understanding can you optimize and simplify that overall journey? Not just can you improve an individual step. And finally, when you’re looking at all the steps in your journey, think about first, not just can I improve this step, can I make this step easier for a customer, but is this step actually necessary in the first place?
Bridget Hewitt-Cartwright:
Do we actually have an opportunity to eliminate this particular step and further simplify and shorten the journey for the customer? If that’s not possible, that’s when you start thinking about, okay, well, how can we minimize the customer effort or just optimize the step overall? So hopefully that’s a helpful taster on journey simplification for you.
And again, something you can take away immediately, start to think about and start to plan with your teams how you’re going to start with this journey visualization particularly. And those are really the main insights we wanted to share with you from this year’s data. Of course, we have an opportunity now for a Q and A, so keep your questions coming through if anything additional comes to mind. And of course after the session as well, if things come up, if you want to discuss any of these one on one, or you would like us to take more people in your team through some of the findings, just reach out to us. I’ll hand over to Alex now to take us through the Q and A.
Alex Boland:
Thanks, Bridget, and thank you for the questions that we’ve got thus far. As Bridget said, if you have more submit them and we’ll still try to get through them. Bridget, the first one is thinking not so much about the research and what’s happened in the past, but the future. It is “What customer experience, CX. What CX challenges do you think the industry will face as it comes out of COVID?” So I assume the banking industry will face as it comes out of COVID.
Yeah, I think, you know, really topical at the moment that we’re seeing a lot of people discuss the media, discuss this kind of looming possibility of increased interest rates, increased inflation in the face of potentially stagnant wage growth for people. So whether that even comes to fruition or not to the extent that some people believe, it is something that’s increasingly in the mind of consumers now, in the back of our minds. In the households of consumers, we’re thinking about, okay, well is my bank providing me the best deal? So people are going from not really thinking about their banking day to day necessarily to starting to think now, okay, is this an opportunity where I could potentially be switching in the next 12 months? So we have an opportunity to really make sure that, at least in the customer context space, that we’re maximizing our opportunities to show people, “Hey, it’s easy to deal with us, you don’t want to leave.” But of course, we need to think about this on a more macro level across the organizations in terms of overall product design, overall value proposition for customers, but really thinking it’s coming to a point where we’re going to start people having that sort of switching mentality in their minds. So what can we do to drive loyalty?
Mm yeah, that’s really interesting to see how that manifests in the future. The second question I have here is directly from the report itself and about that self service and online piece. “Do you have any insights as to why so many customers fail to resolve via self-service and then need to contact?”
Bridget Hewitt-Cartwright:
Yeah, I think from my experience in working with a number of organizations who have implemented self-service and looking at the data in terms of customer use of self-service and sort of those journeys to leave self-service and then try traditional channels. The most common theme tends to be that disconnect between self-service and the rest of the organization. So are we utilizing the insights that our frontline teams and our operational teams are experiencing, and that’s actually feeding back into the digital experience teams or our UX teams. Do we have a real connection between those self-service tools and our customer contact centers? Do we have not just knowledgeable agents, knowledgeable staff, but are we continuously training our self-service tools or even continuously updating our knowledge bases? There tends to still be a disconnect that we experience that customer contact and our sort of traditional human assisted channels have one set of knowledge sitting in a silo from our digital assisted channels or even from our customer facing knowledge bases. So the more we can connect those two entities and sort of knowledge share, system share across them, their experience should be better for the customers. And hopefully we can get more to adopt, and when they do, when they are so willing to adopt, as we’ve seen, actually show them it’s a good experience so we can sort of create that stickiness with self-service.
Alex Boland:
Mm, so a disconnect, a disconnect between channels, but then a disconnect between what the customers want and what the organizations create.
Bridget Hewitt-Cartwright:
Yeah.
Alex Boland:
And not putting customers at the heart.
Bridget Hewitt-Cartwright:
Absolutely.
Alex Boland:
Yeah, thanks for that. They were the two questions that’ve come through thus far. No more have come through as of yet, so I suggest that we wrap this up. You have my details and Bridget’s details on this slide here. The full report will be available for download as well. But thank you for your time today.
Bridget Hewitt-Cartwright:
Thanks, everyone, take care.
Alex Boland:
See you later, bye.