
Service level is one of the most important metrics for a contact center to measure and manage and has been in place since contact centers evolved. However, in our consulting work, we find that this vital metric’s management and targets have yet to evolve from the original definition.
Organizations are missing opportunities to view this metric differently to manage customer service delivery and its associated costs more effectively. This is critical to consistent levels of service throughout the months and days.
Often, in consulting engagements, we are asked questions such as:
- “Is 80/20 the right service level for me, as I heard that was the industry standard?”
- “Should I have the same service level targets for all my queues?”
- “We don’t include calls that abandon in less than “x” seconds (where “x” might be 5, 10, 20, 40). Is that okay?”
- “Is it okay to calculate service level based on calls handled?”
The answers to these are “not likely,” “probably not,” “no,” and “definitely not.”
Understanding the Relationship Between Service Level and Abandonment Rate
The first concept to explore in answering these questions is the relationship between service level and abandonment rate. As the service level declines, the abandonment rate will rise. However, this will vary depending on factors such as your relationship with your callers, the urgency of their query, and the other choices they may have to make to resolve their issue.
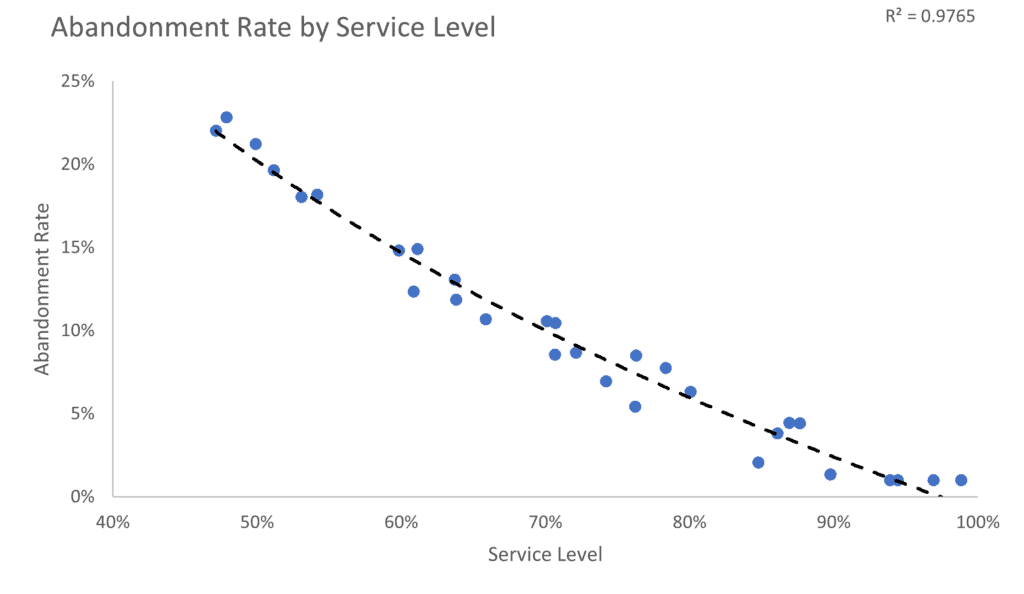
As shown in the above scatter plot, which has a best-fit line plotted, the relationship between declining service level and increased abandonment rate is evident. Something else to note is that when the service level drops further, the slope of the line increases, which means that customers become less tolerant of waiting at an ever-increasing rate.
The key to this analysis is to ask, “What abandonment rate can I live with for my customers?” Generally, this will be in the range of three to five percent for most customer service environments. Unless you are in emergency services, going below three to five percent would exceed customer expectations as some abandons just “happen” when people may have gotten another call or determine that they can process their query at another time.
Finding the Right Service Level for Your Organization
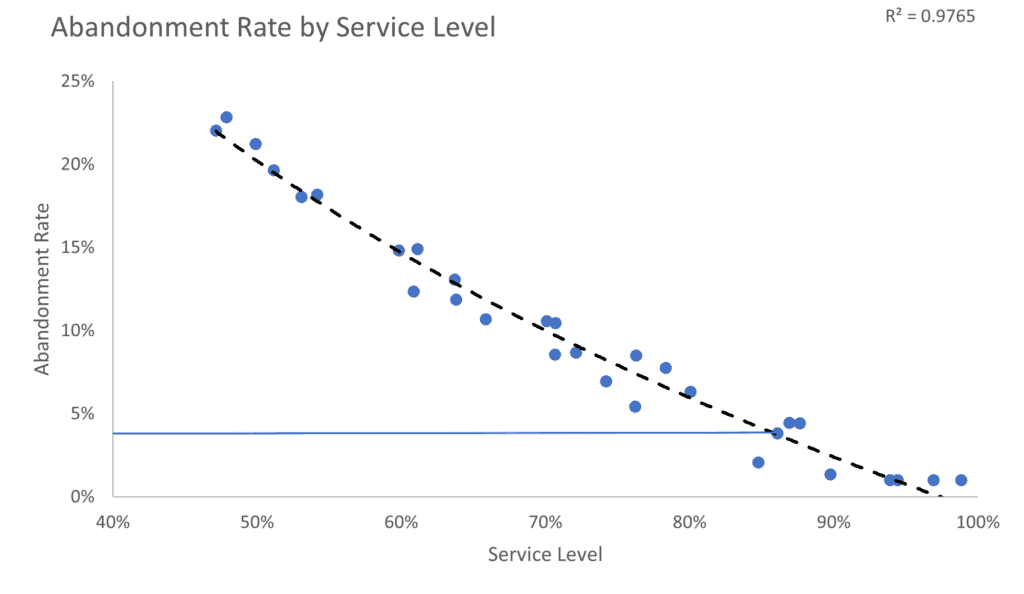
If we go back to the prior diagram and assume we will target a four percent abandonment rate for our organization, then that would lead us to conclude that the appropriate service level target would be 85% in yy seconds. See the diagram below.
Interestingly, the relationship between service level and abandonment rate will vary from one organization to the next. The urgency of the caller’s query, their other choices, and their loyalty to the organization are all factors.
As an illustrative example, think of phoning an airline. If your query was about seating or meal choices, you might call at another time if the service level is low. However, if you were calling to rebook a flight due to a weather cancellation, you would be more willing to wait longer to get to a representative, and thus the abandonment rate would be low.

Training
COPC® Mastering Workforce Management
Balance customer demand, costs and employee needs with proven approaches in forecasting, capacity planning, scheduling and real-time management.
Measure Service Level as a Range Versus a Static Number
Once organizations have established the appropriate service level target based on the desired abandonment rate, it is typically treated as a static number that needs to be met or exceeded (e.g., our target is 80% in 40 seconds.)
COPC fundamentally believes that this is an incorrect way to think about this. Most contact center leaders understand that being below the service level target is a poor customer experience and will lead to higher abandonment rates.
However, some need to appreciate that over-servicing drives higher costs to the business and will lead to lower occupancy levels. Low occupancy is expensive to the company, and callers do not necessarily value faster speeds of answer. In other words, you could deliver fast speed at a higher cost, rarely reflected in increased customer satisfaction or loyalty.
The best practice is to set a range for service level instead of a static target. For example, we aim to achieve between 78% and 85% instead of just above 80%.
Establish Daily or Interval Targets Versus an End-of-Month Target
For this range concept to be effective, you also need to change your thinking from achieving an “end of month number” for service level to thinking of shorter timeframes, such as days or even intervals. One of the issues with an end-of-month number is that poor performance on service level at the beginning of the month can be outweighed by over-delivery at the end of the month to “make the number.”
For example, if we set a daily target, it would be something like, “We want to hit 75% of the days within the month between 78% and 85% service level.” This daily target is much better than an end-of-month number of 80%, as it ensures more consistency throughout the month, and over-delivery cannot compensate for under-delivery.
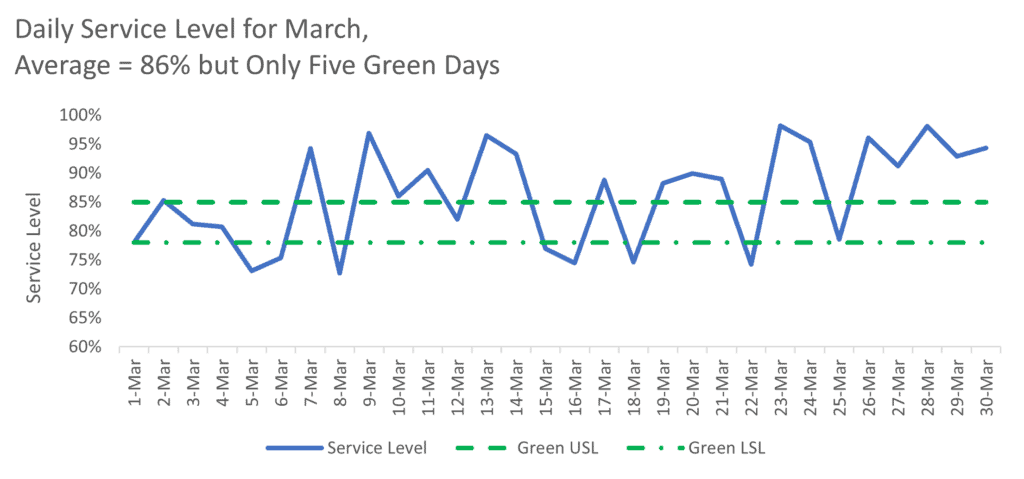
Using Performance Bands for Consistent Measurement
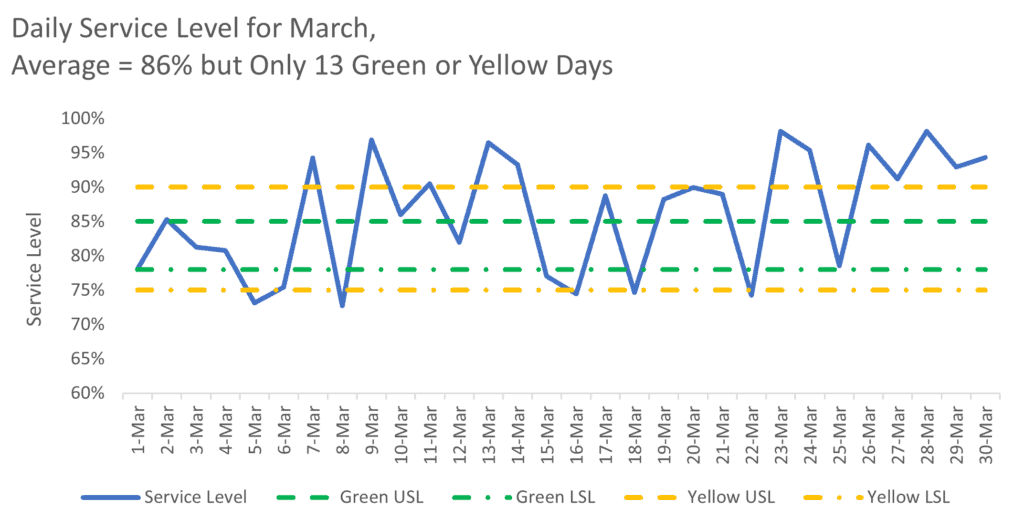
To expand upon the concept further, think about “green,” “yellow,” and “red” performance. Let’s assume your target is to have daily service level performance between 78% and 85% – these would be the “green days.” Now, you could expand upon this further so that performance between 75% and 78%, and 85% to 90%, would be considered the “yellow” days. Days below 75% or above 90% would be “red.”
In this way, you could expand your target to something like, “We want 75% of our days to be green and 85% of our days to be green or yellow.” Again, this is to drive consistency in performance measurement that you will not get from a straight “we want to hit 80% service level” type of measurement.
A further refinement to driving consistency would be to go beyond days and instead measure performance at the interval level. Best practice organizations take this even further and focus on the “prime intervals,” which are the intervals in which they receive most of their volume.
Target setting for measuring performance for a “service level band” is more complex than just setting a straight target, such as 80%. If there is a “tight range (or band),” achieving a high percentage of days or intervals in that range will be more difficult. Conversely, a vast range will allow you to achieve a high percentage of the days or intervals but may not achieve the objective of driving consistent performance.
Refining Service Level Management Over Time
We advise our clients to start with a range such as the examples above (e.g., 78% to 85%) and then track performance at the daily level. Move to interval-level tracking as you improve the percentage of achieved days.
You should also consider the queue size in setting the range, as achieving consistent performance for a minimal volume queue will be more complicated than a larger one. Thus, a larger band might be appropriate for a smaller volume queue.
Research
Global Benchmarking Series, Contact Center Workforce Management
Insights into organizational customer experience objectives, the challenges they face and the programs in place to deliver a seamless experience when customers reach out for support.
Summary
In summary, the concepts we recommend for your organization would be as follows:
- Determine the service level for your queue by determining the “acceptable” abandonment rate you would like to achieve and using historical performance for that queue to determine the corresponding service level you should achieve.
- Set a “band of performance” at the daily or interval levels to drive consistency in service delivery instead of using a static target for service level.
- Implement the metric as the percentage of days or the percentage of intervals in the target band, with consideration of targets for “green” and “green and yellow” performance.
- Track the performance and implement initiatives to improve overall performance.
Hopefully, this article has inspired you to think differently about setting a service level target and tracking performance. The rewards will come in the form of more consistent delivery to your customers.